Visual-Impact
It is inherently difficult to convey the visual impact of a building or a wind farm using a single metric. For this reason, Openwind provides a variety of different measures of visual impact, the idea being that the combination of these might serve to, at best, pinpoint areas of concern.
Figure 155 shows the Zone of Visual Impact (ZVI) settings split into two parts: the metrics to be calculated; and the way in which the calculation is to be performed.
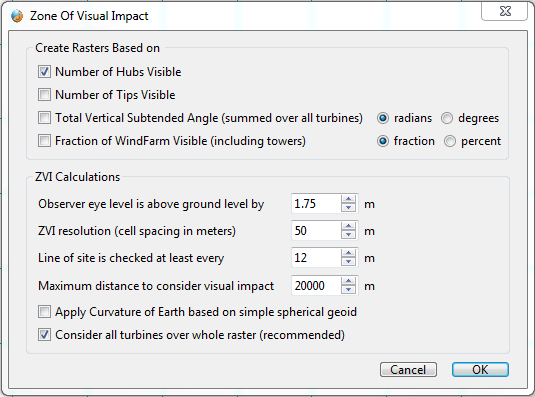
Figure 155: Visual Impact Settings
There are four available measures of visual impact:
Number of hubs visible
Number of tips visible
Total vertical subtended angle - Many turbines may be visible yet they do not represent a significant visual impact due to their great distance (even neglecting the effects of haze), whereas one very close turbine may represent a much greater impact. This metric attempts to take account of this.
Fraction of the wind farm visible - This is similar to the first two metrics but is instead a continuous measure of the fraction of all wind turbines that are visible from the base to the highest point swept by the blade tips.
Openwind creates a separate raster for each of the chosen metrics. Once each raster has been created, it becomes just another raster and is independent of the data and settings that created it. Users will want to make sure to keep created rasters of visual impact up to date for any given layout.
Other parameters used to create rasters of visual impact:
Observer eye level - This is the height above ground level assumed for the average observer.
ZVI resolution - This represents the difference in meters in X and Y between consecutive grid points.
Line of site is checked at least every - This option sets the maximum height-checking interval in meters. The line of site will normally be checked more finely than this parameter states due to the details of the way in which the algorithm is implemented.
Maximum distance to consider visual impact - This is used to size the rasters and also to set a limit on how far away any single turbine can be seen.
Apply curvature of Earth based on simple spherical geoid - This is self-explanatory.
Consider all turbines over entire raster - This partially overrides the “Maximum distance” option to indicate that that distance is only used to calculate the extent of the rasters.
The visual impact is also discussed in the section on Environmental Sensor Layers.