Interpretation
Figure 26 shows the Interpretation tab of the Properties dialog for a Raster Layer containing terrain elevation data.
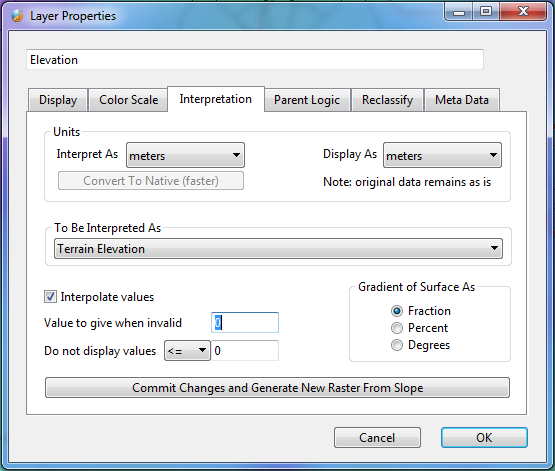
Figure 26: Layer Properties: Interpretation (RasterLayer)
The Raster Layer interpretation tab determines how Openwind will make use of the data contained in the Raster Layer. For continuously varying inputs such as terrain elevation, the Interpolate values checkbox should be checked. For discrete inputs—or inputs such as vegetation height and roughness length that have areas of constant value interspersed with step changes—the Interpolate values checkbox should remain unchecked.
Currently, a raster can offer a range of physical meanings:
Nothing Special - no physical interpretation. This is used for display layers. Such layers do often have a physical meaning; however, if that meaning is not in the list, then users may want to select Nothing Special to indicate that this data type is not currently used by any of the models in the software. The units for a raster interpreted as Nothing Special can still be set for interpretation and display purposes.
Terrain Elevation. This is used to set the base elevation of objects such as turbines and met masts. It can also be used to generate a wind map (see WindMapLayer) or a gradient raster using the “Commit Changes and Generate New Raster Layer” button.
Roughness Length. Users may leverage this to create WindMapLayers or when using the background roughness raster setting within DAWM.
Vegetation Height. This can be used as a displacement height when creating a WindMapLayer or to block lines of site when generating a ZVI or ShadowFlicker map.
Ground Porosity. This can determine the ground effect in the noise model.
Lightning Loss. This can be used to specify a spatially varying energy loss due to lightning.
Blade Degradation Loss. This can be used to specify a spatially varying energy loss due to blade degradation.
Site Access Loss. This can be used to specify a spatially varying energy loss due to problems accessing the site for maintenance.
Icing Loss. This can be used to specify a spatially varying energy loss due to icing.
Temp Loss. This can be used to specify a spatially varying energy loss due to high or low temperature shutdown. This loss will get overridden when using the time series energy capture with the option to include effects of time-varying temperature.
Other Energy Loss. This is a catch-all used by the Energy Capture routine that allows the input of a spatially varying predetermined energy loss not listed above.
Uncertainty - this can be used as part of an uncertainty function. When an uncertainty blended adjustment of a WRG is carried out, a blended uncertainty raster is created and it has to have this interpretation.
Cost Multiplier - this is used in the cost of energy module ( Optimiser for the Cost of Energy (OCOE) ).
Although it might seem fairly obvious that a just-loaded raster is a terrain elevation layer, Openwind needs to be told how to interpret this information. Until a physical interpretation has been set in the Interpretation tab, Openwind sees only a grid of values with no particular meaning and will treat it as a display layer. When one of the models in Openwind does not behave as expected, users will want to check this tab along with the position of the layer in its hierarchy.
The Interpretation tab shown in figure 27 is common to the LineLayers and PolygonLayers, although the list of physical interpretations is tailored to each.
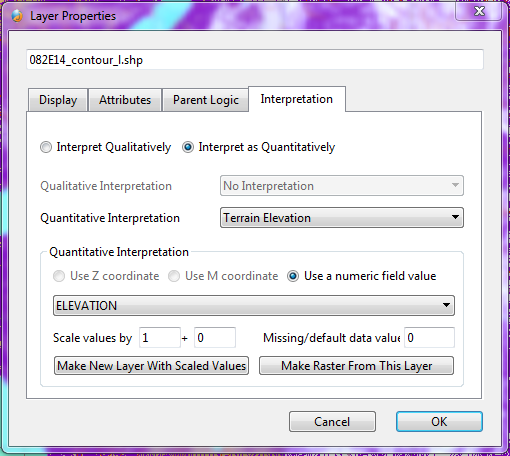
Figure 27: Layer Properties: Interpretation (LineLayer)
Openwind includes the ability to interpret qualitatively for features such as water courses where a value may not be sensible but where certain models still benefit from being informed of their location. An example of this would be a road generation algorithm that uses location of a water course to re-route a section of access road or to increase the cost of that section.
The ability to interpret quantitatively means that the layer can behave in a similar manner to a raster layer or it can be transformed into a similar layer with scaled values or into a raster layer. Generally, the layer will contain information regarding the values it should take at any point within its attribute fields. Figure 27 indicated that the user had selected the Elevation field, so the values for this field would be parsed for each line within this LineLayer and the resulting value would be the value of each line. Our next screenshot—figure 28—shows the Attributes tab for one line object (object 3294) of the LineLayer 082E14_contour_l.shp, which contains contour height information for a part of inland British Columbia. We can see from the attributes that this particular line object is a contour line at 1540 meters above mean sea level.
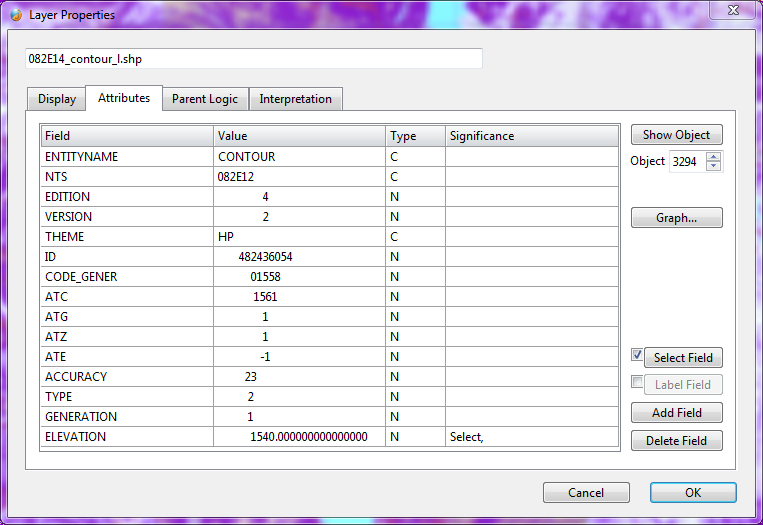
Figure 28: Attributes Tab (Showing a Line Layer with Contour Height Information
Some layers may not contain information regarding their physical meaning within their attribute table. For instance, we may want to import a water body layer and set all areas inside any water-body polygon to 0.0001 to represent the roughness length of the water. In such a case, we could use the “Make New Layer With Scaled Values” button to choose any numeric field (or set a text field to numeric) and then scale with an offset of 0.0001 and a multiplier of 0.0. This would create a new layer that is the same as the current layer but with the chosen field values changed.