Adjust-to-Mast
Although Openwind can be used in a variety of ways, it is recommended that the user import into the software a time series of data spanning an integer number of years. The data should be quality-controlled, adjusted to long-term conditions (if desired), and extrapolated to hub height, and should include wind speed, direction, temperature, turbulence intensity, and (optionally) air density. (Air density can be calculated in Openwind from the met mast altitude and the temperature time series.)
The wind-flow model (WRG or WRB format) can be imported from UL, another consultant, desktop software such as WAsP or Meteodyn WT, or calculated inside Openwind using the WindMap module. If imported into Openwind, the hub height WRG should be adjusted to mast by making all the hub height met mast layers children of the WRG and then right-clicking on the WRG and selecting “adjust to masts”.
Regardless of whether one chooses to adjust to mast using an inverse uncertainty weighting or inverse distance squared weighting, the fundamental method is the same. For distance squared it involves the following steps repeated for each direction, dir, in the original WRG:
Calculate the ratio between the met mast mean wind speed and the WRG mean wind speed for each mast and call this the wind speed ratio Ri, where i is the index of the mast
Calculate the ratio between the met mast probability for this direction and the WRG probability and call this the frequency ratio Fi
For each grid node in the WRG with coordinates, x, y, the new wind speed, U, is calculated by:
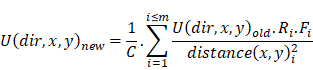
Where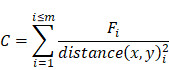
And m is the number of met masts.
The probability of this direction at each grid node can be calculated in one of two ways:
Overwriting sector-wise probabilities, P, with those at the met masts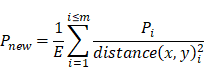
Or scaling the directional distributions in the WRG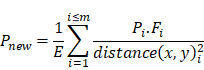
Where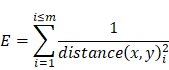
In all the cases above, the term  could, in principle be replaced by another term which could include a mixture of distance and elevation difference, say, or uncertainty. In practice, the uncertainty blending in Openwind is more complex, as it accounts for the degree to which groups of masts can look like a single mast from a distant point. However, that is the subject of its own white paper.
The adjust to mast process, as shown above, results in the sector-wise wind speeds and probabilities in the WRG matching the met mast values at the mast locations. It effectively assimilates the met mast data into the WRG. This process removes the need to run a wind flow simulation for each mast (as is typically done for WAsP), and then to blend the results. By creating one wind flow and adjusting to all masts in Openwind, the same end result is achieved in a more integrated and efficient way.
Given that the software adjusts the WRG to the values at the met masts and that the resulting new WRG matches the met mast values at the met mast locations, it is not necessary to use point WRGs in the energy capture routine. Extracting point WRGs from the WRG should give the same mean wind speeds as at the met masts and so the wind speed ratios will remain the same either way. If the WRG mean wind speeds and directional distributions do not match the met mast values at the mast locations, then it is necessary to use point WRGs extracted from the WRG or created as part of the same process as the WRG.
Assigning turbines to individual met masts for a project in which a blended adjustment of the WRG to the masts has been performed tends to produce a more continuous result, without the discontinuities that occur when separate WRGs are created from each mast.
One issue that has been remarked upon by users is that the mean wind speeds at the turbine locations do not always match the mean wind speeds shown in the wind speed raster. This is because the directional distribution in the WRG varies from location to location within the WRG whereas the standard energy capture uses the unadjusted met mast frequency table. This is justified by the argument that we want to give precedence to the measured distribution. The WRG is used only to scale the wind speed before it is input to the power curve function.
There is an option to scale the directional distribution in the met mast frequency table by the changes in directional distribution in the WRG. This will tend to mean that the mean wind speeds at the turbines vary as in the WRG.
The adjust to masts dialog is shown below.
Figure 1: Adjust to masts dialog
- Adjust to Masts Based on Reciprocal of
- Distance – this is not really used but the weighting of each met mast is proportional to one over the distance from that mast at each point in the grid.
- Distance Squared – the most commonly used option and is the one talked about above. This weights the contribution of each met mast, at any point in the grid, by one over the distance squared.
- Modelling Uncertainty – this is the wind speed uncertainty due to the turbines not being positioned at the met mast and is calculated according to the uncertainty settings described in section Uncertainty. Depending on the uncertainty settings, this can read Modelling Plus Uncorrelated Uncertainty.
Adjusted WRG Name – this is the name of the adjusted WRG. It should generally include the original WRG name.
Overwrite WRG Probabilities Adjusting to Mast – this method is not recommended. Instead of scaling the probabilities in the original WRG, it replaces them with the inverse distance-squared weighted probabilities from the met masts being used to adjust.
Adjust K values – this replaces the K values in the WRG by the inverse distance-squared weighted K values in the met masts being used to adjust.
Correct Overall Mean Wind Speeds – this is executed as a second step after the regular adjust to masts step. It performs an adjust to masts in a similar fashion to that described above but only adjusting wind speeds based on the inverse distance squared weighted overall mean wind speed.
Use covariances in adjust to mast by uncertainty – this is a modification of the adjust to mast by uncertainty, the effect of which is to treat distant groups of met masts as correlated sources of uncertainty.
Make starter polygons, WRG copies and assign masts to copies – this is a time-saving measure given that most people follow the same procedure after carrying out an adjust to masts.
Make validity rasters, WRG copies and assign masts to copies – when adjusting by uncertainty, this option creates validity rasters, WRG copies and met mast copies and puts them in a usable order grouped under a single folder layer which can then be dragged to be a child of a site-layer.
Output Statistics to File – this will write text to one or more stats files showing how well the adjust to masts process worked as well as comparisons with single mast adjustments.
Explore Parameters – opens a diagnostic tool used to preview adjustment behaviour before applying any adjust‑to‑masts operation. It reports cross‑prediction error metrics for speed and Directional Deviation (DD), which is explained further down in this page. The map‑adjustment method selected in the Adjust to Mast dialog has no effect on these results. The metrics are presented for single mast adjustments and for all but one mast adjustments, sometimes referred to as “leave one out” cross predictions.
Lowest Height Only – restricts results to the lowest height in a multi‑height WRG. This option is generally recommended, as prediction errors are typically larger at lower heights.
Ratio Relax / Weight – includes the Ratio Relaxation and Weighting map‑adjustment method in the analysis, so their performance can be compared with the standard approach.
All Only – outputs aggregated cross‑prediction pairs rather than individual pairs. This option can simplify comparison between methods, especially in projects with many measurement locations and heights, and is easily toggled on and off.
Output Metrics – writes the Explore Parameters results to a text file.
Figure 2: Adjust to masts dialog (uncertainty)
Ratio Weighting and Ratio Relaxation Methods
The main idea is that the wind speed and frequency ratios for each direction sector are weighted according to their reliability (evaluated by a factor called Replicability Factor) and the Directional Deviation (DD) of the grid point with respect to mast location. So that the ratios of wind speed and direction frequency to be applied in the adjustment vary across the map, instead of using the same ratios (i.e. the one obtained at mast location) such as in the standard adjustment method. For any grid points in the WRG, the adjusted WRG wind speed and frequency are thus calculated as
Where Ry_d and Fy_d are defined for a specific sector (d) and a specific WRG grid point (y).
To obtain those ratios the following steps are followed:
- Calculate the Ri and Fi for each sector such as in the standard WRG adjustment method
- Evaluate the replicability of these ratios
- Calculate the wind speed ratios (Ry _d) to be applied at another WRG grid point (location y)
- Calculate the frequency ratios (Fy _d) to be applied at another WRG grid point (location y)
Steps 2, 3 and 4 are described below. It should be noted that the “Ratio Weighting” and “Ratio Relaxation” methods only differ in the calculation of the wind speed ratios (Step 3). The calculation of the frequency ratios (Step 4) is the same for both methods.
Where: The Frequency Factor (FFi_d) is calculated as the minimum value between fi_d and fi_d_RawWrg.
The Frequency Ratio Factor (FRFi_d) is calculated as following
The replicability factor RF is also an indicator of how well the raw WRG matches the met mast wind rose at the mast location.
Wind Speed Ratios
For the calculation of wind speed ratios at a certain WRG location y (Ry _d) we propose the following two methods: Ratio Weighting and Ratio Relaxation. The general idea for both WRG adjustment methods is to calculate an adequate directional wind speed ratio at any given WRG grid point based on the speed ratio at the mast location weighted by the replicability factor of that sector and the similarity/difference in wind roses between the WRG grid point and the met mast. For both approaches the weighting is based on the replicability factor and the direction deviation but the difference is in the function used for the weighting. Both methods are described below.
Ratio Weighting
In the Ratio Weighting method, the wind speed ratios Ry _d, depend on
- Wind speed ratio in sector d (Ri_d)
- Replicability factor (RFi_d)
- Direction Deviation of the point y with respect to mast location i (DDy _i)
- Wind speed ratios in nearest sectors (Ri_d1) where d1≠d
Using this formula, for calculating the wind speed ratio in a certain sector d, a weight is given to the ratios of each sector as function of the Replicability Factor (RF) of that sector and a parameter fs_d (DDy _i,SectDists_d) that depends on the distance to the analyzed sector d and the Direction Deviation of point y:
Where: • Norm(d,DDyNsect ) is a normal distribution centered at d with standard deviation DDy _iNsect. At d the sectorial distance is 0 (SectDists_d = 0). See figure 3 • Nsect is the number of sectors of the WRG (12, 16, etc.)
Figure 3: Normal distribution of the weight of each sectorial ratio as a function of the sectorial distance
Figure 3 shows the variation of Ry _d for a sector d with Ri_d = 0.935, while the mean value of the Ri_d weighted for their RFi_d is 0.845. It should be noted that the nearest sector s has a high replicability Factor and an Ri_s = 0.77. Analyzing the curve in figure 2.2 for RFi_d = 0.01 we can see that: • For null DDy _i, Ry _d is equal to Ri_d, • For low DDy_i values (but higher than 0), the effect of the nearest sector is prevailing • When DDy _i tends to 1, Ry _d tends to equal the mean values of the ratios at mast location weighted by their replicability factors.
These trends are smoother when RFi_d is higher (dark blue and light blue curves).
Figure 4: Normal distribution of the weight of each sectorial ratio as a function of the sectorial distance
Ratio Relaxation
In the Ratio Relaxation method, the wind speed ratios Ry _d, depend on
- Wind speed ratio in sector d (Ri_d)
- Replicability factor (RFi_d)
- Direction Deviation of the point y with respect to mast location i (DDy _i)
Where is the ratio between mast and raw WRG mean wind speeds at point i
Figure 5 shows the variation of Ry _d for the same sector previously described (figure 2.2). It should be noted that the ratio between mean wind speeds at mast location is Ri = 0.87. Analyzing the curve in Figure 3 for RFid = 0.01 we can see that: • For null DDy _i, Ry _d is equal to Ri_d, • As DDy _i, increases, Ry _d tends to equal the ratio between mean wind speeds at mast location
These trends are becoming linear when RFi_d is higher (dark blue and light blue).
Figure 5: Example of the variation of the Wind Speed Ratio (Ratio Relaxation) as a function of the Direction Deviation and the Replicability Factor
Frequency Ratios
As said previously, the calculation of the frequency ratios is the same for both “Ratio Weighting” and “Ratio Relaxation” methods.
The Frequency ratio (Fy _d) is calculated as a function of a. Replicability Factor (RFy _d) b. Direction Deviation of the point y with respect to mast location i (DDy _i) As shown, the proposed method for calculating the frequency ratios is very similar to the “Ratio Relaxation” one for the wind speed ratios.
Figure 6 shows the variation of Fy _d for the same sector previously described, in which Fi_d = 0.78. Analyzing the curve for RFi_d = 0.01 we can see that: • For null DDy_i, Fy_d is equal to Fi_d, • As DDy_i increases, Fy_d tends to 1
These trends are becoming linear when RFi_d is higher (dark blue and light blue).
Figure 6: Example of the variation of the Frequency Ratio as a function of the Direction Deviation and the Replicability Factor